Saturday, October 26, 2024

Market Equilibrium

     Market Equilibrium 


Market Equilibrium is a market situation in which quantity supplied and quantity demanded is Equal.


In the above graph shows the Market Price is on vertical axis and quantity is on horizontal axis.


At point E quantity supplied and quantity demanded is equal.Demand curve is downward sloping, because when price increase of a goods and services, quantity demanded of this goods and services decreases and when the price of goods and services decrease,the quantity demand of this goods and services increase.Price and quantity demanded are negatively related.


Supply curve is upward sloping, because when's price increase of a goods and services, quantity supplied of this goods and services also increases and when the price of goods and services decrease,the quantity supplied of this goods and services decrease.Price and quantity supplied are positively related.



Supply |Law Of Supply | Supply Schedule |Supply Curve

                  Supply

Supply is the certain amount of goods and services that sellers are willing and able to provide to consumers at various prices .

                Law Of Supply

All other things unchanged, when the price of goods and services increases , the quantity supplied of this goods and services also increases and when the price of goods and services decreases , the quantity supplied of this goods and services also decreases .

                 Supply Schedule

Supply schedule is a table that shows the positive relationship between price and quantity supplied


In the above table , when price 2, quantity supplied 10, when price increases 2 to 4, quantity supplied increases 10 to 15.when price increases 4 to 6 , quantity supplied increases 15 to 20.

                               Supply Curve

supply curve is a graph that shows the positive relationship between price and quantity supplied.


Price is on vertical axis and quantity supplied is on horizontal axis.Supply curve is upward sloping, because price and quantity supplied is positively related.when price increase, quantity supplied also increases and when  price decrease, quantity supplied also decreases.
  

Friday, October 25, 2024

Demand | Law Of Demand | Demand Schedule | Demand Curve | Demand function

                     Demand 

Demand is the willingness and ability to purchase goods and services of consumers at various prices .

                    Law Of Demand

All other things unchanged ,when price increases of goods and services , the quantity demand of this goods and services also decreases  and when the  price decreases of goods and services , the quantity demand of this goods and services also increases .

                      Demand Schedule

Demand Schedule is a table that  Shows the inverse relationship between price and quantity demanded.


                Demand Function
Qd =a-bP
Qd=Quantity demanded (Shows that how price determine quantity demand of goods and services)

a=intercept(shows quantity demand when price zero)
b=slope of the demand function
P=price of goods and services

                                              Demand Curve


Demand curve is a graph that shows the inverse relationship between price and quantity demand .Demand curve is downward sloping because when price increases , quantity demand also decreases and when price decreases , quantity demand also increases of goods and services. 

Thursday, October 24, 2024

Opportunity cost and trade off

           Opportunity Cost 

Giving up something else to get something and the value of the thing given up is called opportunity cost 


For Example Of Opportunity cost

 Between study and sleep , if one studies without  sleep ,then sleep is his / her opportunity cost.

                                           OR

Between Book and dress, if someone purchase book without dress , the dress is his / her opportunity cost .


                          Trade Off

Trade -off usually refers to the decision that depends on the opportunity cost .If we want to take one thing out of two things , we must give up  the other thing. That is , if we want to increase the quantity or quality of one thing , we  must decrease the quantity or quality of the other thing.

                               For Example Of Trade Off


Anyone can trade off between studying and vacationing . If someone studies without taking vacation or taking vacation without studies.


Wednesday, October 23, 2024

Positive Economics & Normative Economics

                Positive Economics  

Positive economics focuses on economic phenomena and describes and explains those phenomena.

Positive economic statements are descriptive and precisely measurable.  


 Example Of Positive Economics


Government raises taxes to increase its revenue.
                           
             Normative Economics

Normative economics emphasizes on value judgment for the development of various economic activities.

Normative economics deals with what will and should be.

 Example Of Normative Economics

If the government wants to increase the disposable income of the people then it has to reduce the tax and if government wants to increase the revenue then it has to increase the tax.

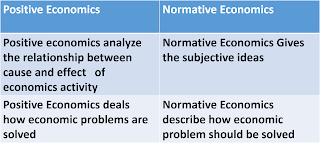
                 Positive VS Normative Economics 


Positive Economics describes economic phenomena .It gives no opinion and  Normative Economics gives opinion on various economic activities . Positive Economics Is Descriptive and  Normative Economics is Prescriptive.

Positive economics analyze the relationship between cause and effect   of economics activity .
Positive Economics deals  how economic problems are solved.
Normative Economics Gives the subjective ideas  and Normative Economics describe how economic problem should be solved.

Sunday, October 20, 2024

C=400+0.7Y I=200+0.2Y Calculate Savings in Closed Economy??

  C=400+0.7Y

 I=200+0.2Y

Calculate Savings  in Closed Economy??

In closed economy,
Y=C+I
Y=400+0.7Y+200+0.2Y
Y=600+0.9Y
Y-0.9Y=600
0.1Y=600
Y=600/0.1
Y=6000

Equilibrium income Y=6000
 C=400+0.7Y
C=400+0.7×6000
C=400+4200
C=4600

Y=C+S
S=Y-C
S=6000-4600
S=1400
Consumption 4600 and savings 1400

Saturday, October 19, 2024

What is Economics and different definitions of economics by different economists


Economics : Economics is the key to the development of a society.


In our society  , resources are limited but scarcity is unlimited.Economics balances unlimited scarcity with limited resources.The main goal of economics is the fulfills our needs by limited resources.


Economics is involved in every aspect of our life.


Economics ensures the production of goods and services and their equitable distribution using limited resources so we can say economics is the study of scarcity.The main goal of economics is to try to satisfy the limited resources and to achieve the welfare of the society.

Economics definition is defined by different economists is the different ways.Adam smith is the known as the father of economics.


According to Adam Smith,  

     "Economics is the science of       wealth "

       According to Adam Smith,

Economics deals with production, distribution and consumption.


According to Samuelson,

"ECONOMICS IS THE STUDY OF HOW PEOPLE AND SOCIETY CHOOSE WITH OR WITHOUT THE USE OF MONEY,TO EMPLOY SCARCE PRODUCTIVE RESOURCES WHICH COULD HAVE ALTERNATIVE USES.TO PRODUCE VARIOUS COMMODITIES OVER TIME AND DISTRIBUTE THEM FOR CONSUMPTION NOW AND IN THE FUTURE AMONG VARIOUS PERSONS AND GROUPS OF SOCIETY ".


According to Lionel Robbins,


"The science which studies human behaviour as a relationship between ends and scarce means which have alternative uses"
                          ..................


Market disequilibrium | Excess Supply | excess demand

Market disequilibrium | Excess Supply | Excess demand Market is not in equilibrium, because there is either excess supply and excess demand ...